Add OpenSearch as a Log Receiver
OpenSearch is a distributed, community-driven, and 100% open-source search and analytics suite licensed under Apache 2.0. It can be used for real-time application monitoring, log analysis, website search, and more.
OpenSearch is backed by the Apache Lucene search library and supports a range of search and analysis features such as k-Nearest Neighbors (KNN) search, SQL, anomaly detection, Machine Learning Commons, Trace Analytics, full-text search, and more.
OpenSearch provides a highly scalable system, allowing users to explore their data easily through integrated visualization tools.
Starting from KubeSphere v3.4.0, OpenSearch v1 and v2 are integrated into it and set as the default backend storage for the logging, events, and auditing components.
Prerequisites
-
You need a user with cluster management permissions. For example, you can log in to the console directly with the
adminuser or create a role with cluster management permissions and assign it to a user. -
Before adding a log receiver, you need to enable the
logging,events, orauditingcomponents. For more information, see Enable Pluggable Components. This tutorial enablesloggingas an example.
Use OpenSearch as a Log Receiver
In KubeSphere v3.4.0 and later, OpenSearch is the default backend storage for logging, events, or auditing components. Configure as follows:
$ kubectl edit cc -n kubesphere-system ks-installer

apiVersion: installer.kubesphere.io/v1alpha1
kind: ClusterConfiguration
metadata:
  name: ks-installer
  namespace: kubesphere-system
spec:
  common:
    opensearch:   # Storage backend for logging, events, and auditing.
      enabled: true
      logMaxAge: 7             # Log retention time in built-in Opensearch. It is 7 days by default.
      opensearchPrefix: whizard      # The string making up index names. The index name will be formatted as ks-<opensearchPrefix>-logging.
For KubeSphere versions below v3.4.0, please upgrade first.
Enable Logging via the Console and Use OpenSearch as the Backend Storage
-
Log in to the console as the
adminuser, click Platform in the upper left corner, and select Cluster Management. -
Click CRDs, enter
clusterconfigurationin the search bar, and click the search result to view its detailed page.

- Under Custom Resources, click the three dots on the right side of
ks-installer, select Edit YAML.

- In the YAML file, search for
logging, change theenabledfromfalsetotrue. After that, click OK in the lower-right corner to save the configuration.
common:
  opensearch:
    enabled: true

logging:
  enabled: true
Change Log Storage to External OpenSearch and Disable Internal OpenSearch
If you are using KubeSphere's internal OpenSearch and want to change it to your external OpenSearch, follow these steps:
- Run the following command to update the cluster configuration:
kubectl edit cc -n kubesphere-system ks-installer
- Set
opensearch:externalOpensearchHostto the address of your external OpenSearch and setopensearch:externalOpensearchPortto its port. Comment or delete thestatus:loggingfield. Here is an example:
apiVersion: installer.kubesphere.io/v1alpha1
kind: ClusterConfiguration
metadata:
  name: ks-installer
  namespace: kubesphere-system
spec:
  common:
    opensearch:
      enabled: true
      externalOpensearchHost: ""
      externalOpensearchPort: ""
      dashboard:
        enabled: false
status:
   # logging:
     #  enabledTime: 2023-08-21T21:05:13UTC
     #  status: enabled
If you want to use the visualization tools of OpenSearch, set opensearch.dashboard.enabled to true.
- Run the following command to restart
ks-installer.
kubectl rollout restart deploy -n kubesphere-system ks-installer
- Run the following command to delete the internal OpenSearch. Make sure you have backed up the data in it.
helm uninstall opensearch-master -n kubesphere-logging-system && helm uninstall opensearch-data -n kubesphere-logging-system && helm uninstall opensearch-logging-curator -n kubesphere-logging-system
Query Logs in KubeSphere
- All users can use the log query feature. Log in with an account, hover over the icon in the lower right corner, and select Log Query from the pop-up menu.
![]()
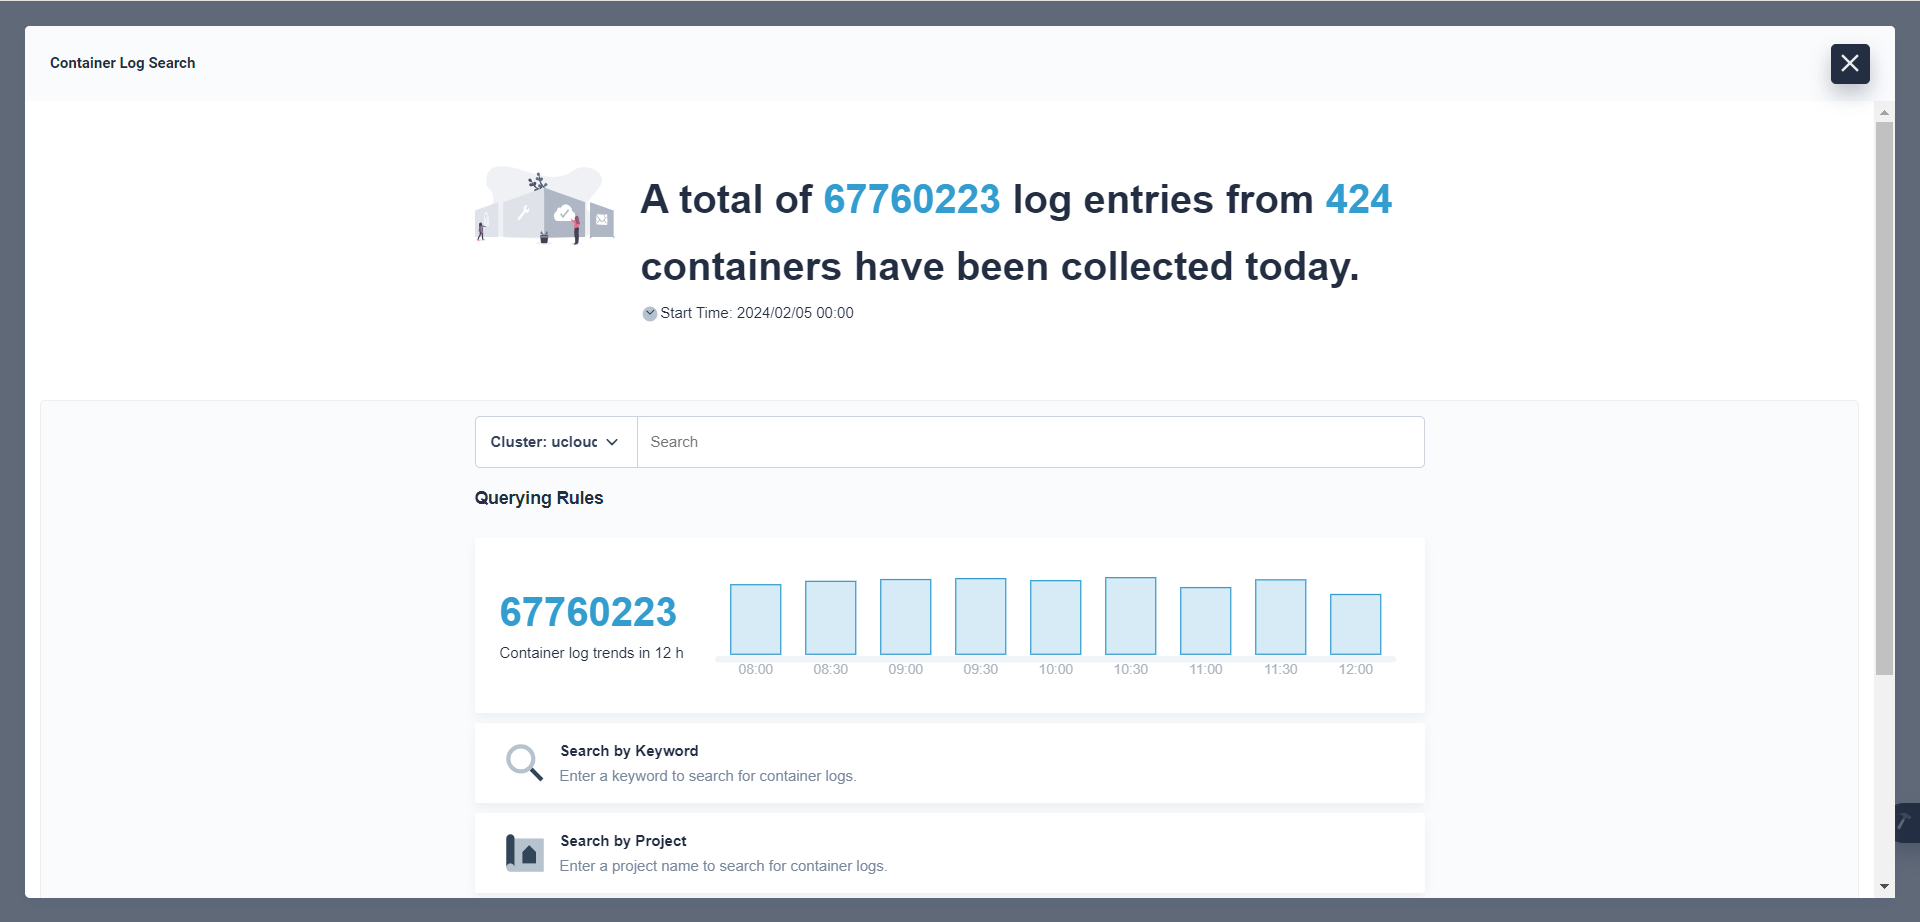
- In the pop-up window, you can see the time histogram of the number of logs, the cluster dropdown list, and the log search bar.

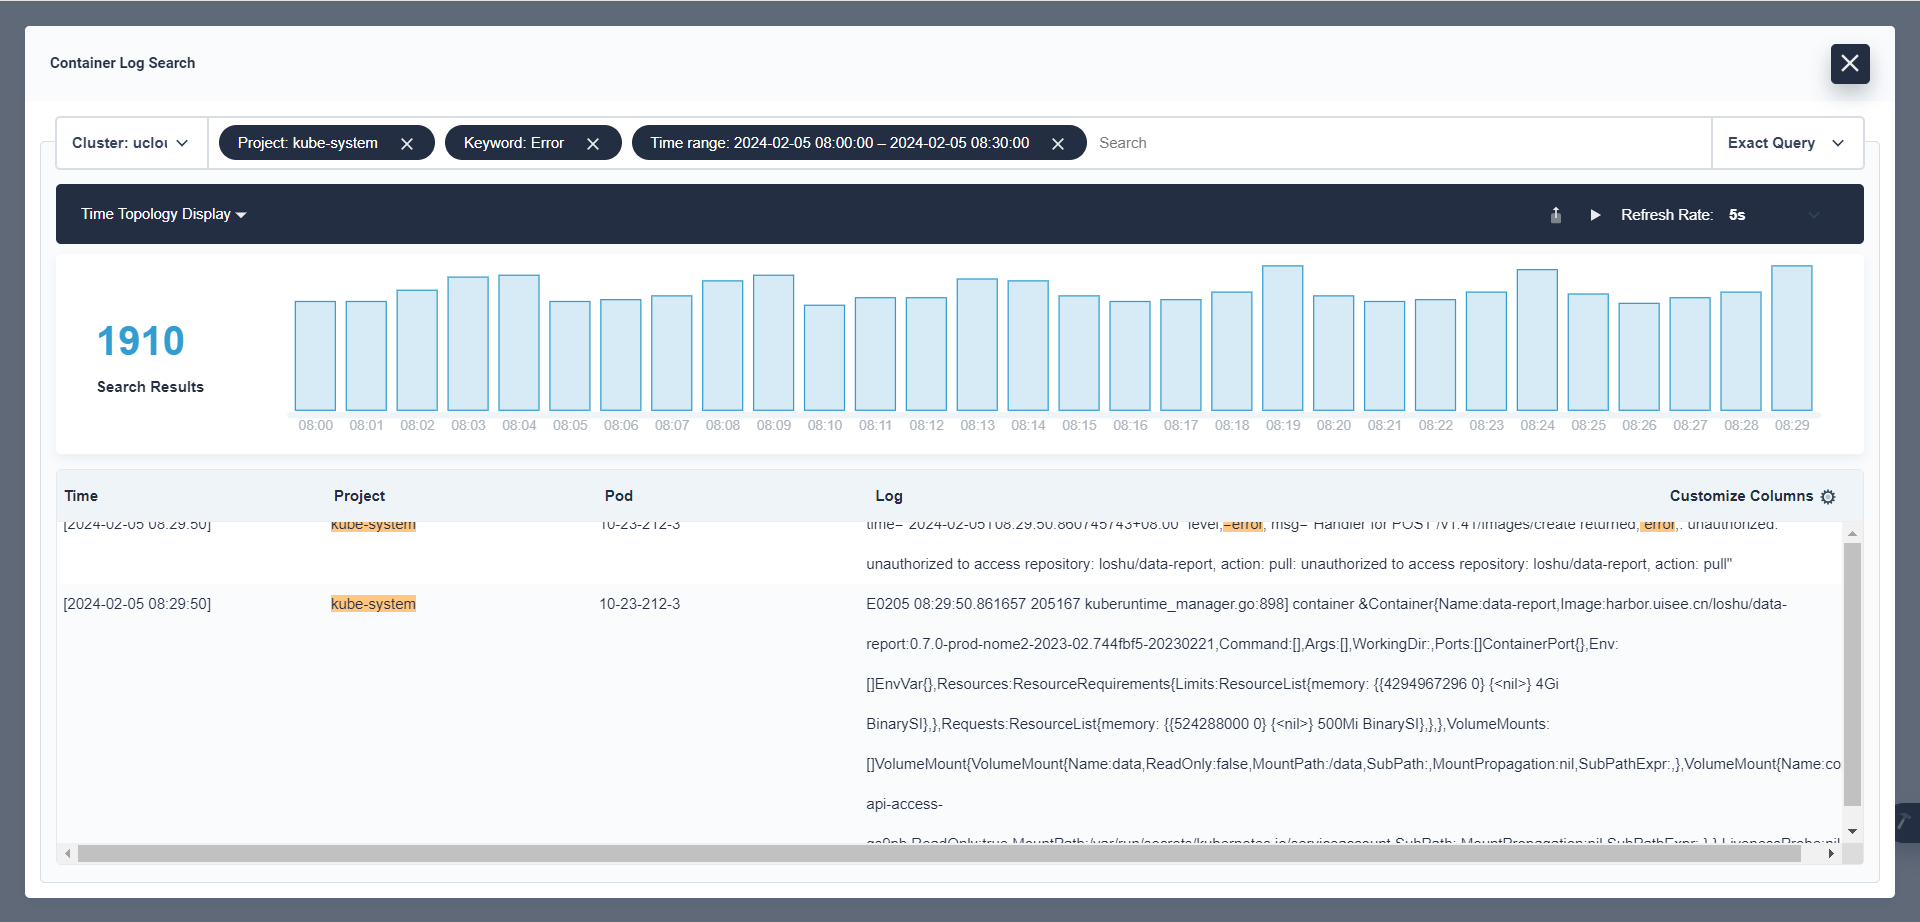
- Click on the search bar and search for logs by message, workspace, project, resource type, resource name, reason, category, or time range (e.g., enter the time range: last 10 minutes to search for logs in the last 10 minutes). Alternatively, click on the bar in the time histogram, and KubeSphere will show logs in the time range of that bar.

Feedback
Was this page Helpful?
Receive the latest news, articles and updates from KubeSphere


 Previous
